Sometimes the daily deluge of email yields an unexpected pearl – perhaps because it offers hope, communicates clearly or is just a darn good idea. A few days ago, the 6th Thriving Places Index (TPI) dropped into my e-lap and it is really worth a look.
The Thriving Places Index (TPI) consists of a set of indicators that measure the local conditions for wellbeing in local authorities throughout England and Wales. It includes easy-to-read diagrams and maps (who doesn’t love a map?) which show if wellbeing is being delivered fairly and sustainability. This kind of information is important for rapid transition, enabling communities to know where they are and to work out where they want to be. It is also key in creating just transitions, because it creates a measure for communities to compare themselves against – in this case, rating against national averages.
It provides a fascinating example of how real, live data can help us to measure, track and then tackle important and complex issues at community level. The report provides a snapshot of what it is like to live in different regions across the UK; if you want to experience England’s lowest levels of anxiety then try Rutland, for the cleanest air it’s Cumbria and to reduce your energy bills, a move to Kent is worth considering.
If maps are not your thing, then there is also a 4 side ‘Key Findings’ summary report on England and a link to Welsh findings with Data Cymru publishing the ‘Key Findings’ for this independently. Apparently, the Welsh government is serious about analysing and improving wellbeing. Perhaps our own government could learn a thing or two?
The Index is run by the Centre for Thriving Places, who state the aim of the Index is to “support decision makers across sectors to assess and prioritise policy, based on the impact it has on the wellbeing and sustainability of people and communities”. They describe it as a “new compass for the 21st century” and “a practical tool for designing and delivering better places for people and planet”. I can imagine local authorities pouring over this to check where they stand – particularly in comparison with neighbouring areas. The private sector is by no means the only place where competition for status is fierce.
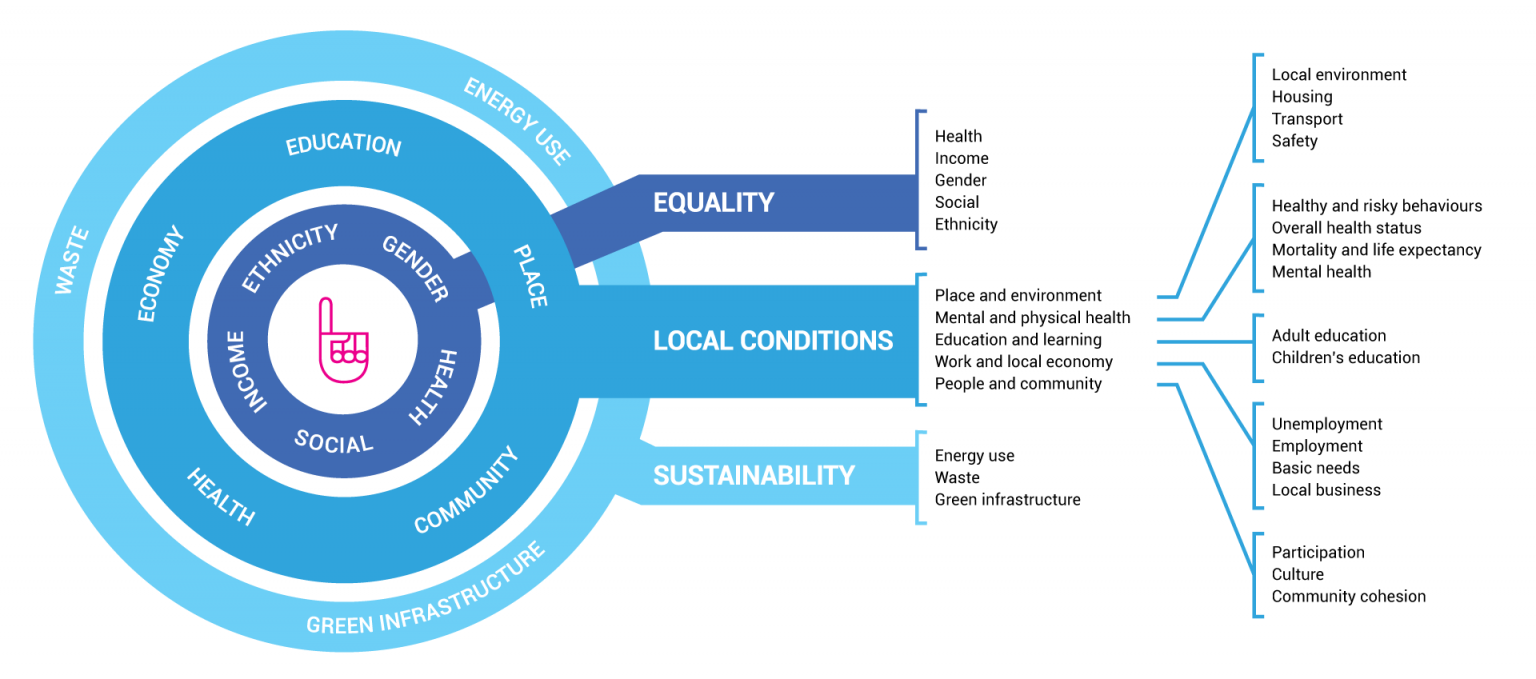
The TPI measures the drivers of wellbeing at local authority level using a broad set of indicators selected from datasets produced by reputable sources such as the Office for National Statistics (ONS), Fingertips Public Health Data and the Index of Multiple Deprivation (IMD). For a more global comparison, the Global Wellbeing Indicators are worth a look. Despite the differences between data collection systems and the challenges in comparing them, these kinds of ranking systems can encourage us to learn better from the example of others – as the Alliance does through its stories – and improve our global wellbeing.
